Simpsonville, SC · Revenue operations, analytics & systems

I build the systems that find the revenue.

Ingestion and data pipelines, performance dashboards, forecast and simulation engines, and the tooling that acts on what they surface — built against a live operation, most of it while I was carrying the number it served. Twenty years in B2B revenue is why the models are built around the operator’s economics rather than a textbook’s.

Every model on this site runs live in your browser rather than being pictured. The claims that no project can evidence are marked as claims.

10
Systems live in production
19
Systems built or shipped
21
Years in B2B revenue
Millions
In ACV sourced and closed across the career
80%+
Of closed revenue self-sourced, last three roles
2
Revenue functions built from zero

Internal tools and shipped dashboards — the live models run below.

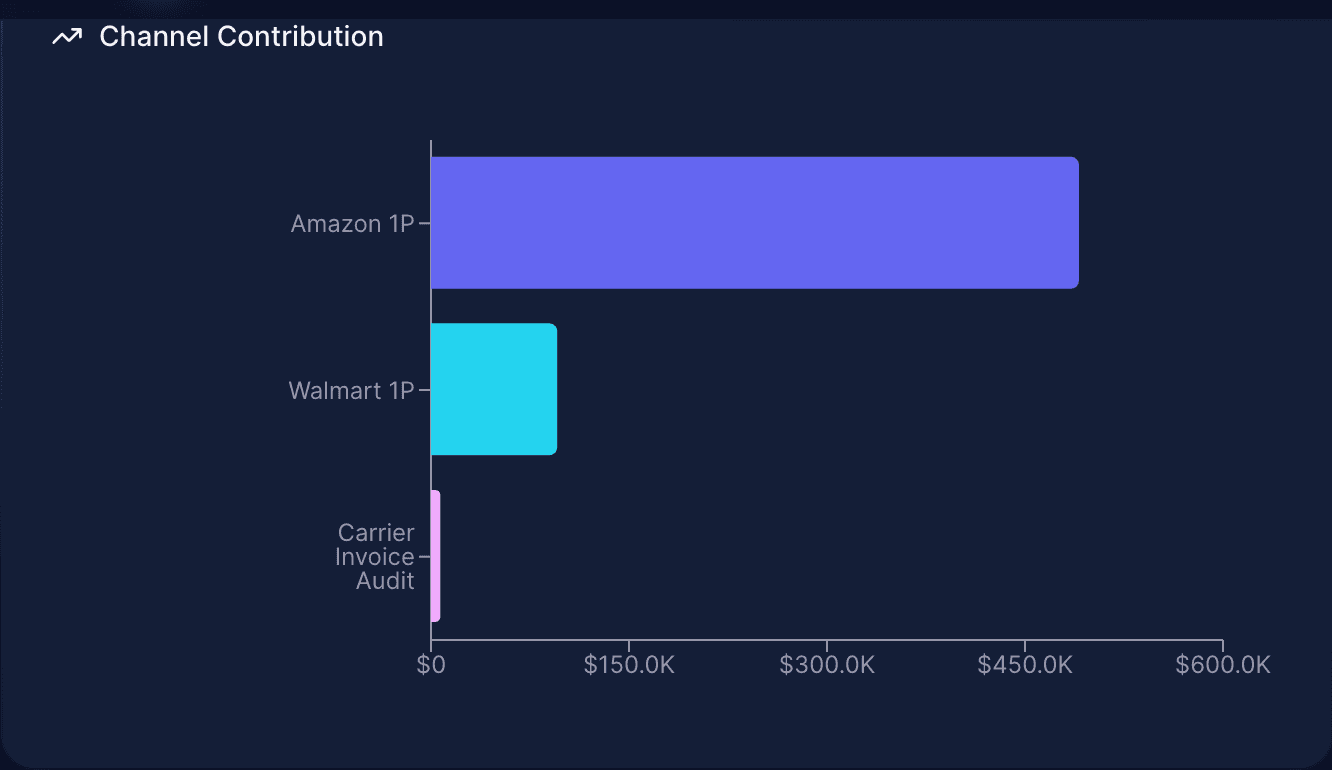
Recovery analysis view with a channel contribution bar chart
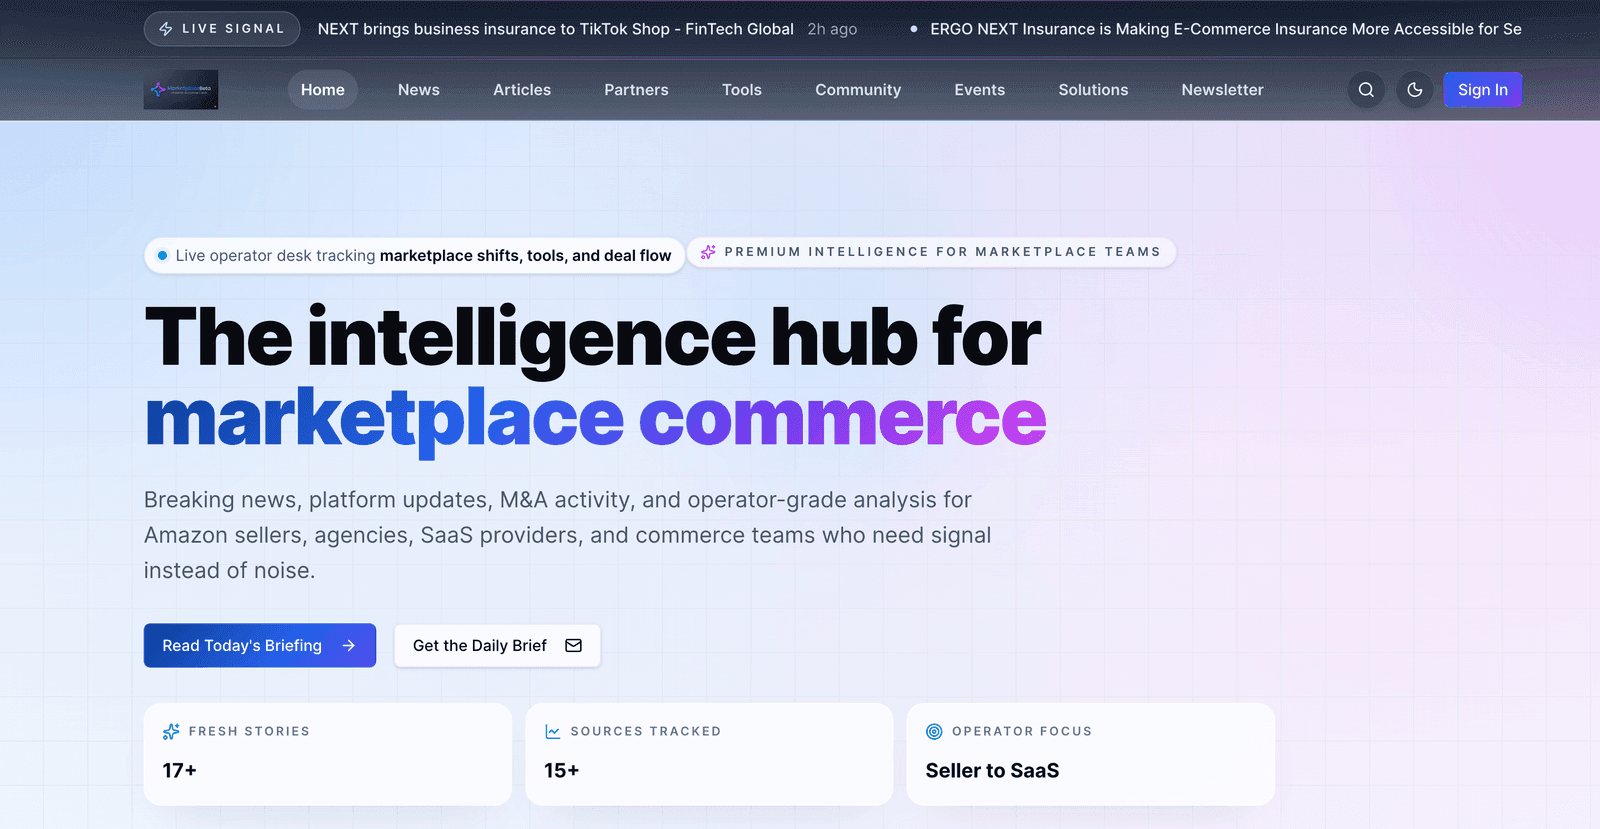
MarketplaceBeta home page with a live news ticker and coverage statistics
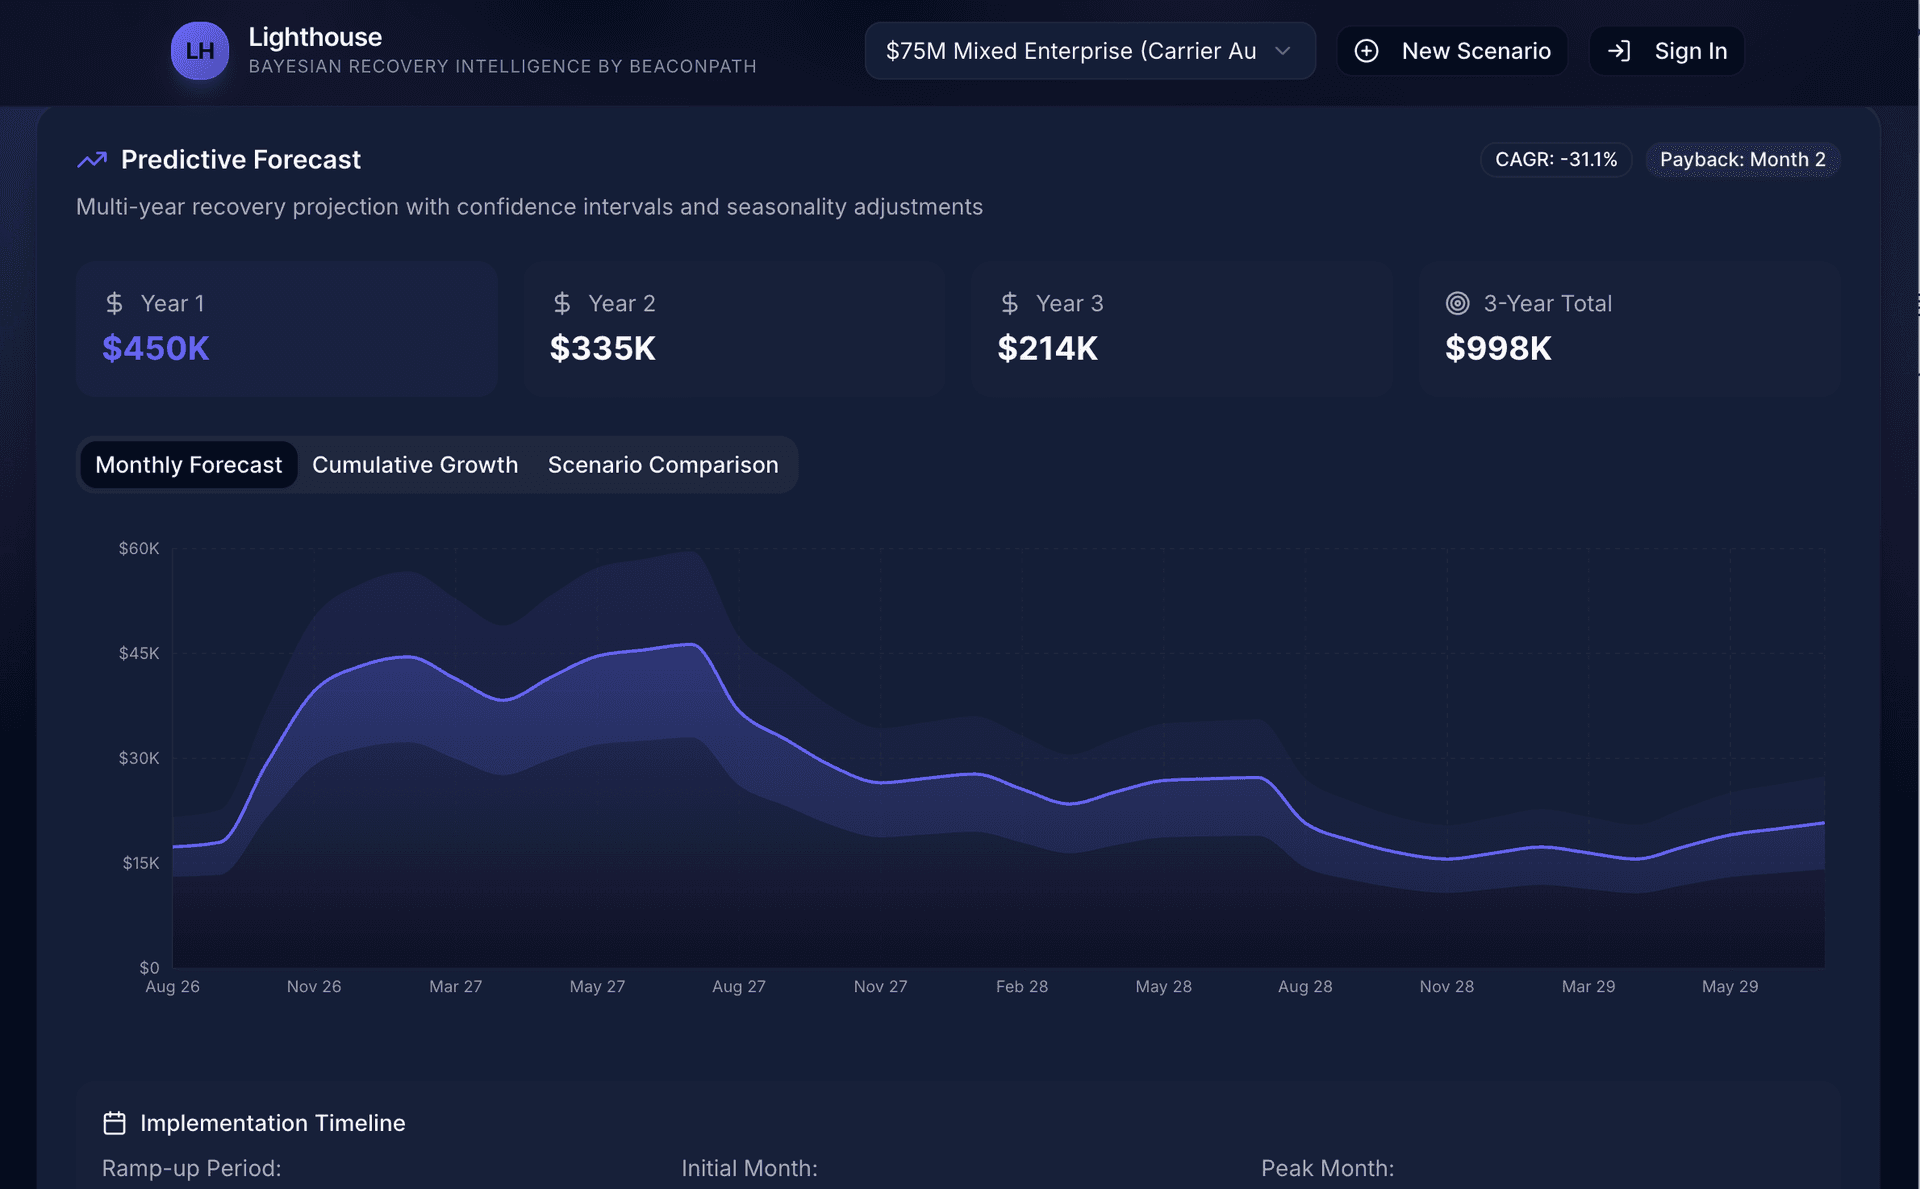
Multi-year recovery forecast with confidence bands and seasonality
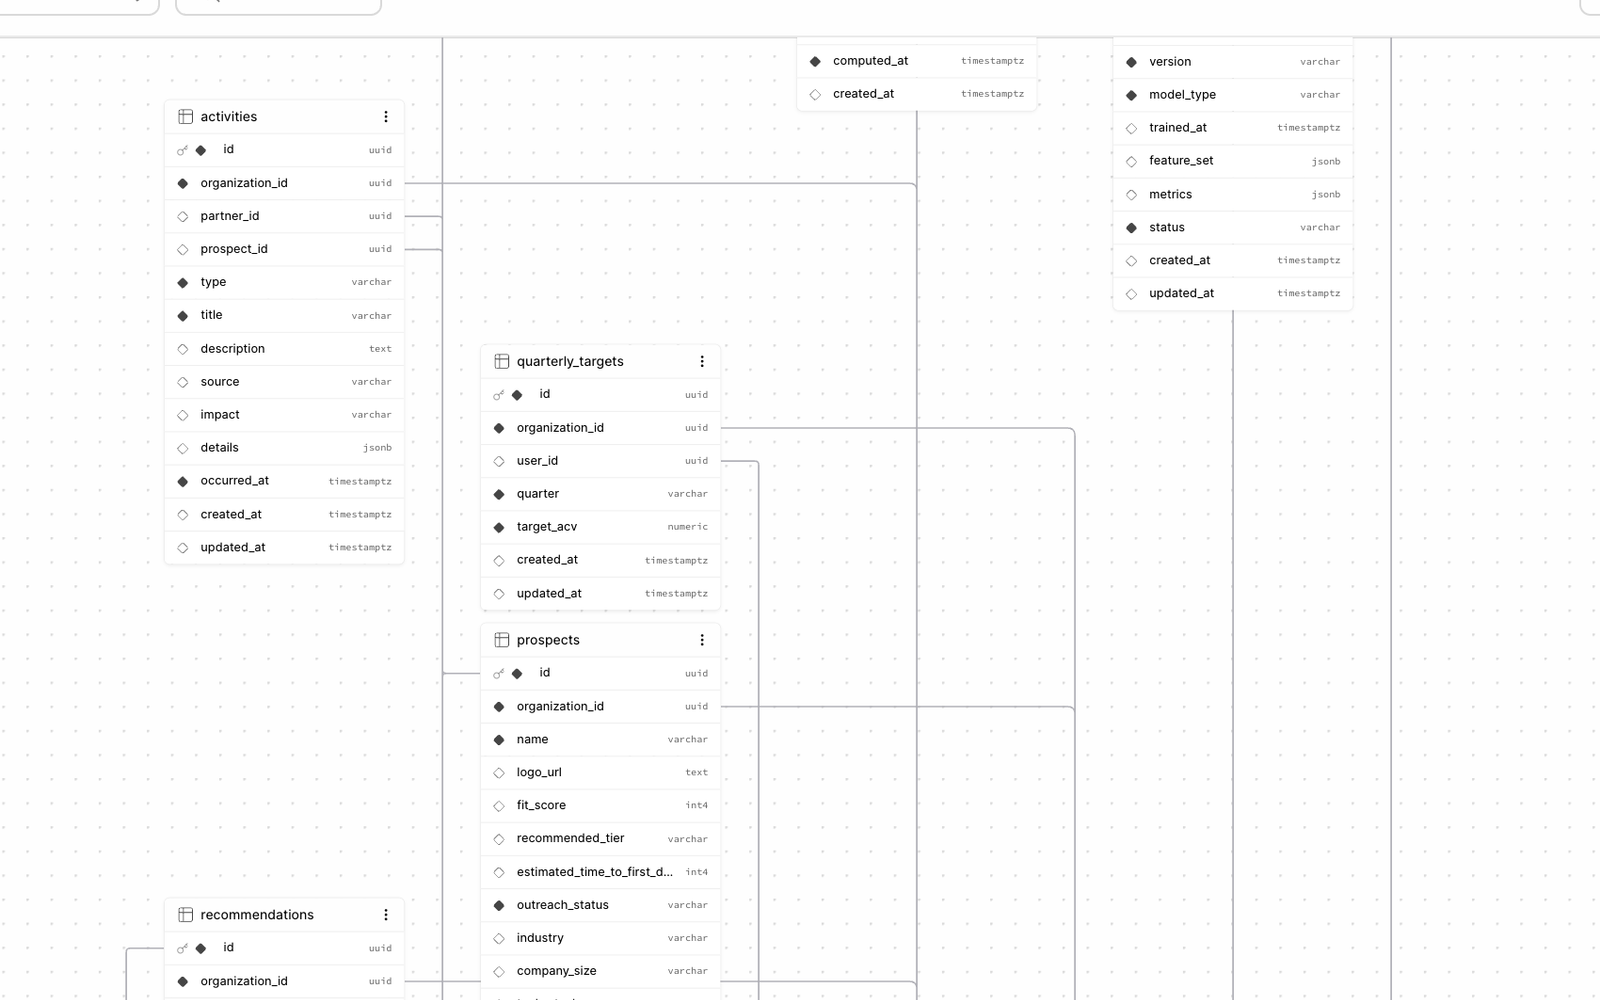
Postgres schema visualiser showing related account, prospect and quarterly target tables
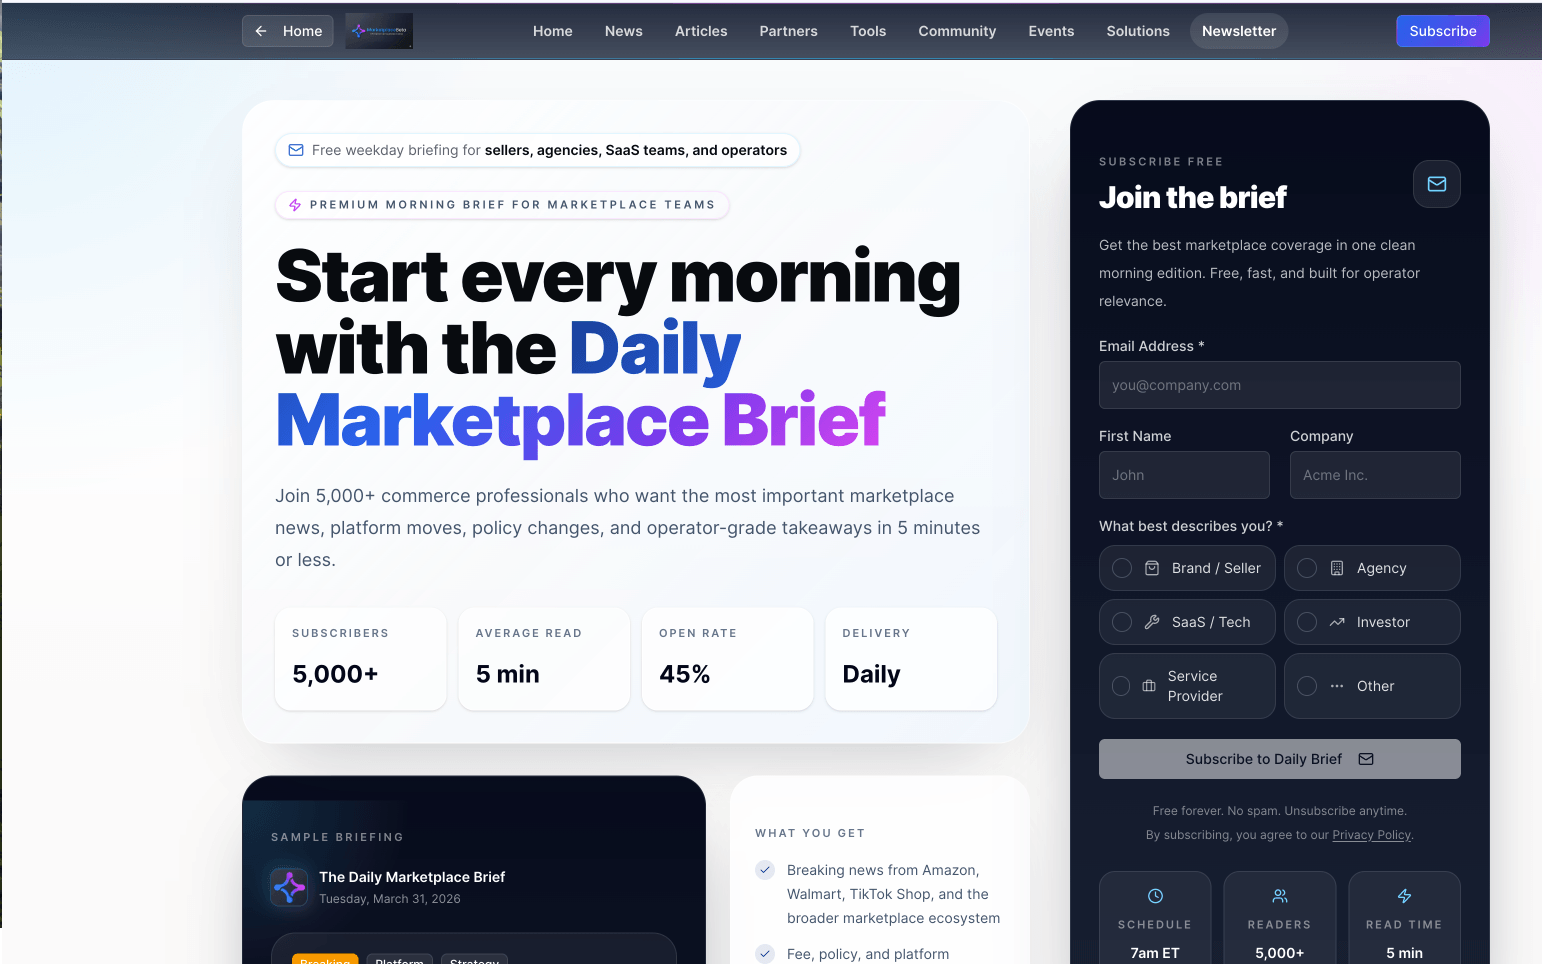
Daily marketplace brief signup page with subscriber statistics and a subscribe form

How I work

Instrument it, find what is underperforming, prove why, then ship the fix

Every tool on this site came out of a specific point in a real operation where something was unmeasured, slow, or wrong. This is the loop they sit in — the job at each stage first, what most teams do instead second, and the systems underneath it third.

  1. 01

    Instrument

    Make the data exist at all. Most revenue questions are unanswerable not because the analysis is hard but because nothing is recording the thing being asked about — the pipeline lives in one system, the fulfilment data in another, and the join between them is nobody’s job. I build the system of record and wire it to the systems around it: a business development CRM architected from scratch and integrated with the company ERP to carry pipeline, outreach status, opportunity scoring, and estimated ACV; a Postgres schema with row-level security behind an account portal; an outbound console consolidating four separate tools into one workflow.

    The usual substitute is a spreadsheet that gets rebuilt every week, and it fails quietly — not by breaking, but by being three days stale in a way nobody can see. By the time the data is trustworthy enough to act on, the window it described has closed.

  2. 02

    Monitor

    Make movement visible while it is still cheap to act on. That means a live view rather than a quarterly deck: channel-sourced ACV trending against target, account activation as it happens, and a standing intelligence program tracking twenty competitors and seven platform surfaces weekly, mapped to product line so a finding lands on someone’s desk with a decision attached to it.

    A manual quarterly reporting cycle tells you what happened one quarter after you could have changed it. The failure mode is worse than lateness: a metric nobody watches between reviews is a metric that drifts for eleven weeks and then gets explained rather than fixed.

  3. 03

    Pinpoint

    Find what is underperforming, and rank it by what it actually costs rather than by how visible it is. This is the stage that pays for the other four. A carrier and logistics spend analysis surfaced an annualised late-fee exposure nobody had aggregated because it arrived as line items across separate invoices. A profitability suite ranks a catalogue by margin contribution rather than by revenue, which reorders it substantially. A deal analyser screens acquisition candidates against fixed criteria so the weak ones are cheap to reject.

    Ranking by revenue puts the loudest line at the top and buries the one quietly costing the most. Averages do the same thing to a heavy-tailed distribution: the mean describes the winners and says nothing about the long tail where the recoverable money usually is.

  4. 04

    Diagnose

    Prove why, with a method that survives being argued with. Dependence modelled explicitly with a Gaussian copula rather than assumed away, because correlated line items widen a forecast interval far more than independence implies. Bayesian updating on activation rates, because an account that activated one of two times is not a fifty per cent account. Regression for elasticity where the relationship is worth quantifying. Every output carries its interval and the conditions that would make it wrong.

    A single-point estimate invites the reader to argue with the number instead of the decision. Showing the distribution moves the conversation to what to do about the downside — and it is also the honest reporting of what a model actually knows.

  5. 05

    Execute

    Ship the thing that closes the gap, rather than filing a request for it. A finding that ends in a recommendation is half a job. The recovery wizard turns the analysis into a guided flow an operator can actually run; the enablement portal does the account’s onboarding work for it instead of scheduling another check-in call; the prompt tooling puts the qualification framework where the conversation happens. Same week, against real accounts, while carrying a number.

    The standard path is a ticket, a roadmap, and two quarters. The cost is not only the delay — it is that the person who understood the problem is not the person who eventually builds for it, and the specific thing that made it worth solving does not survive the handoff.

One of them, running right here

The forecast I built because mine was lying to me about risk

Standard pipeline forecasting treats every deal as independent. They aren't — quarter-end pressure, budget cycles, and shared activation capacity make them move together, which is why a confident-looking number understates real risk in both directions. This is the model from my own forecast engine, running in your browser. Drag the correlation.

Role lens

Reading this for a specific role?

Paste the job description. Claude Haiku reads it against the same data file that renders this page and reorders the shelf for that role. The model selects and orders — every fact on screen still comes from the source file.

Selected work

The five that changed how the number got hit

Status labels mean what they say. Live is deployed and reachable. Built runs but isn't hosted. Nothing here is inflated to the next tier up — including the case study where the finding was that my own first estimate was 2.5× too high.

BuiltThreecolts

Sales ACV Forecast Engine

Pipeline forecasts treat deals as independent events. They are not — quarter-end pressure, macro conditions, and shared activation capacity make them move together. Assuming independence produces a forecast that looks confident and understates real risk in both directions.

+41%
P10–P90 spread widening vs. independence
28% → 34%
Floor-miss probability, corrected
$199K / $182K
Monte Carlo P50 vs. Bayesian P50
+10.3 pts
Top tornado lever
PythonNumPySciPypandasMatplotlibClose CRM API

Runs locally. The interactive above is a browser reimplementation of the same copula model.

LiveFounder

Marketplace Beta

Amazon, Walmart, and marketplace agency operators have no single credible resource tracking what is actually changing in their industry — and that audience is exactly the buyer profile worth reaching.

77+
RSS sources ingested
Next.jsTypeScriptTailwind CSSshadcn/uiSupabase / PostgreSQLVercelVercel CronVercel AI GatewayResendReact EmailClaude SonnetClaude HaikuDALL·E 3
LiveThreecolts

Amazon Recovery & Profitability Suite

Brands cannot see true per-ASIN profitability, and nobody could credibly size 3P reimbursement recovery without either guessing or overselling it.

2.5× overstated
Correction to initial recovery estimate
−1.30 (R² 0.76)
Rank elasticity of revenue
Gini 0.83 · HHI 1,511
Catalog concentration
20,000
Monte Carlo trials
PythonpandasNumPyMonte Carlo simulationBayesian shrinkageOLS regression
BuiltThreecolts

QBR Dashboard & Revenue Ops Command Center

Channel program quarterly reviews were assembled by hand every cycle. Leadership got a static snapshot well after the fact, with no forward view and no way to interrogate it.

ReactSupabase / PostgreSQLTypeScriptBayesian updatingOLS regression

Multi-user version designed and specced, deliberately not deployed on cost grounds.

LiveThreecolts

Weekly Growth Brief Engine

Staying current on marketplace platform changes and competitor moves is roughly a full day of research a week — so in practice it never happens consistently, and go-to-market decisions get made on stale information.

7
Platform surfaces monitored
20
Competitors tracked
ClaudeAutomated web researchPythonopenpyxlStructured HTML reportingScheduled execution

Everything else

The rest of the shelf

Revenue Systems & Forecasting

LiveThreecolts

Channel Enablement Portal

Channel accounts sign after getting excited about the revenue share, then go quiet and never actually introduce anyone. Time-to-first-referral ran around ninety days, and the standard response — more check-in calls — treats the symptom.

ReactNext.jsRechartsSupabase / PostgreSQLRow-level security
BuiltThreecolts

Prospecting Command Center

Outbound ran across four disconnected systems. Reps spent their day switching tabs and hand-carrying data between tools instead of having conversations.

ReactSupabaseSalesforceApollo APILinkedIn Sales Navigator
LiveVoadera

Business Development CRM & Forecasting Engine

Lead and prospect data lived in spreadsheets disconnected from the company system of record. Outreach status, opportunity potential, and pipeline value were updated by hand and stale by the time anyone looked. Forecasting was an educated guess.

Monday.comERP integrationWorkflow automationMonte Carlo simulationBayesian updating
LiveThreecolts

Revenue Pipeline CRM

A net-new channel program with no system of record, no funnel definition, and no way to see which accounts were going cold.

Monday.comWorkflow automationLead scoringExcel
In ProgressThreecolts

Channel Health Dashboard & Slack Workflow

Channel health signals lived across disconnected systems. Nobody saw an account going quiet until it was a churn conversation instead of a save.

ReactSupabaseSlack APIAutomated workflows
BuiltIndependent

LeadPrompter

LinkedIn Sales Navigator rewards precise Boolean queries and almost nobody writes them well, so reps default to broad searches and work bad lists.

JavaScriptBoolean query generation

AI Products & Pipelines

LiveMarketplace Beta

Article & Topic Classifier

An aggregation engine ingesting at volume is worthless if everything lands in one undifferentiated feed. Relevance has to be decided at ingest, not by the reader.

Claude HaikuSupabaseAutomated pipeline
BuiltMarketplace Beta

PriceScope

Resale pricing is fragmented across eBay, Facebook Marketplace, Craigslist, OfferUp, and Mercari, and no single view tells you what something is actually worth or which listing is genuinely underpriced.

ReactStatistical scoringRecharts
BuiltMarketplace Beta

AgencyForecast

Agencies model their clients’ businesses constantly and their own almost never. The question of which lever actually moves agency profit usually gets answered by instinct.

ReactRechartsWeighted ensemble forecasting
BuiltIndependent

Stellar Advisor Platform

Amazon sellers looking for agency help have no reliable way to find one that fits, and good agencies waste enormous effort on leads that were never a match. Both sides are searching blind.

HTMLJavaScriptVercel

Financial & Acquisition Analysis

BuiltThreecolts

FBA Deal Analyzer Pro

Evaluating an Amazon product opportunity means unit economics, multi-year projection, inventory planning, cash flow, and risk — normally across five disconnected spreadsheets.

Next.jsReactTypeScriptFinancial modeling
LiveThreecolts

3T Recovery Wizard

A recovery estimate on its own is half an answer: a seller sees how large the opportunity could be, but not how likely it is to pay out — or how much to trust the number.

Next.jsReactSupabase / PostgreSQLBayesian updatingError propagation
BuiltBeaconPath Holdings

Universal Business Acquisition Analyzer

Evaluating acquisition targets means normalising inconsistent seller financials, testing valuation against comparable multiples, and modelling whether debt service actually works — repeated on every deal, by hand, in a different spreadsheet each time.

PythonStreamlitpandasFinancial modeling
LiveBeaconPath Holdings

Acquisition Deal Pipeline & Target Database

Acquisition deal flow arrives from brokers, marketplace listings, and direct outreach at once, every target at a different diligence stage with its own financials and seller conversations. A spreadsheet collapses around thirty targets.

NotionAirtableRelational database designPythonStreamlit
AnalysisThreecolts

Carrier & Logistics Spend Analysis

A high-volume shipper suspected carrier overspend but had no way to size it from raw invoice data.

PythonpandasExcelInvoice analysis

Strategy & enablement

  • 1P Market Strategy ReportThreecoltsFindings repositioned the ICP and redirected outbound targeting and messaging.
  • Sales Enablement SystemThreecoltsGave a net-new channel program a repeatable enablement and outreach standard from day one.
  • Company AI All-Hands Case StudyThreecoltsTurned an individual build into an organisational reference point for what applied AI looks like inside a commercial function.

Build method

And how each one actually got built

  1. 01

    Find the friction

    Sitting inside the revenue motion, not adjacent to it. I feel the problem before anyone files a ticket about it.

  2. 02

    Structure the solution

    Define the job to be done, the data required, and where AI does the work versus where a human decides.

  3. 03

    Build it

    Next.js, React, Supabase, Python. Multi-model pipelines with model tier matched to task and cost.

  4. 04

    Ship and iterate

    In front of real users on a cadence — then improve it based on what actually gets used, or shut it down.

Stack

What I actually work in

Quantitative
Monte Carlo simulationGaussian copula modelingBayesian updating (conjugate priors)OLS regressionBayesian shrinkageSensitivity analysisKalman filtering (graduate coursework)
AI
Claude SonnetClaude HaikuDALL·E 3Multi-model orchestrationModel-tier selection by task and costPrompt engineering and evaluation
Frontend
Next.jsReactTypeScriptTailwind CSSshadcn/uiRecharts
Backend & data
Supabase / PostgreSQLPythonpandasNumPySciPyStreamlitREST APIsScheduled cronopenpyxlpython-pptx
Infrastructure
VercelVercel AI GatewayGitHubResendSlack API
Revenue stack
Monday.com (architected at two companies)SalesforceApolloSales NavigatorDripifyNotionAirtableERP integration
Domain
Amazon 1P / 3P / FBAVendor CentralWalmart MarketplaceTikTok ShopMarketplace recoveryCarrier spendAgency operationsChannel partnerships

The record — live, from the work data

Two tracks, twenty years, one of them starting empty

The top line is the commercial job and it never breaks — every chapter carried a number. The bottom line is one dot per system on the shelf, read out of the same file that renders the work below. Pick a chapter.

The full profile, capability ledger, and printable résumé live on the about page.

The commercial half

And the revenue motion the loop was built inside

The loop above is not abstract — it ran inside a quota. This is the commercial motion it served, stage by stage, with the same systems mapped against it. It is also the part of the record that transfers directly to a business development, partnerships, or sales leadership role.

  1. 01

    Source

    Originate the pipeline rather than receive it. Across my last three roles more than 80% of what I closed was self-sourced — territory I mapped, accounts I identified, conversations I opened cold. That starts with defining the ICP from evidence rather than convention and building the target list against it: at Threecolts I authored a 1P market strategy report that repositioned the company ICP toward enterprise Vendor Central agencies and redirected outbound targeting.

    Most teams buy a list and work it broadly, because writing a tight query is nobody’s job. Volume goes up, conversations go down. The deeper version of the same problem is a seller whose number depends entirely on someone else filling the funnel — when marketing spend moves, so does their quota attainment.

  2. 02

    Qualify

    Size the opportunity on the customer’s economics, not the vendor’s pitch. I built the discovery and qualification frameworks the whole team sold on, and I evaluate every account on margin profile, sell-through, and risk before committing to it.

    An oversized estimate wins the first meeting and loses the account. I caught my own recovery model overstating by 2.5× and rebuilt it bottom-up before it reached a client.

  3. 03

    Prove

    Long-cycle, multi-stakeholder deals get won by the person who brings the working model instead of the deck. I bring one — with the uncertainty shown, and a reliability score that says when the number is defensible and when it is directional.

    A single-point estimate invites the buyer to argue with the number. A range with an honest confidence band moves the conversation to what to do about it.

  4. 04

    Close

    Negotiate terms, structure, and performance expectations. I built the hybrid retainer-plus-performance commercial model at an agency and the deal-desk practice governing commercial exceptions, then negotiated channel terms across three product lines.

    Pricing invented per deal is how margin leaks and how reps stall. A structure with a documented exception path lets the team move without escalating everything.

    What I built for this stage

  5. 05

    Activate

    A signature is not revenue. I own the lifecycle after it — enablement, onboarding, activation, co-sell — and built the portal that does the account’s work for them so the gap between intent and first referral collapses.

    Channel accounts sign excited and go quiet. Time-to-first-referral ran about ninety days, and the standard answer — more check-in calls — treats the symptom.

  6. 06

    Forecast

    Own the number leadership plans on. I ran departmental forecasting, pipeline hygiene, and CRM operations for a team of six, and I built the reporting that replaced a manual quarterly cycle with a live view and a forward projection.

    A forecast that is one confident number understates risk in both directions. Showing the distribution is what makes the commitment credible.

How I work

Instrument it, find what is underperforming, prove why, then ship the thing that fixes it.

The work is a loop, and I have run every stage of it. Instrument the revenue so the data exists at all — ingestion, schema, the joins nobody wants to own. Monitor it so movement is visible while it is still cheap to act on. Pinpoint what is underperforming and rank it by what it actually costs. Prove why, with a method that survives being argued with. Then build the thing that closes the gap, rather than filing a request for it. Everything on this site is a stage of that loop, built against a real operation while it was running.

What makes the analysis worth trusting is where it was done. These are not exercises on a public dataset. The recovery engine was rebuilt bottom-up after I caught my own first version overstating by 2.5× — sized off revenue rather than units × landed cost — before it ever reached a client. The forecast engine reports a distribution rather than a point, because a single confident number understates risk in both directions. The QBR dashboard applies Bayesian shrinkage because an account that activated one of two times is not a 50% account. Every one of those is a decision about honesty first and technique second.

The commercial record underneath it is the reason the models are built the way they are. Twenty years in B2B revenue: founding sales hire who built a commercial function from zero and led a team of six to quota, then a net-new channel revenue stream built from nothing, with millions in annual contract value sourced and closed across it and more than 80% of that self-sourced across my last three roles. That is not a separate career from this one. It is why the unit economics in every model here are the operator’s, why the forecasts get shown to people who have to commit to them, and why I know which number a business actually acts on.

What I want next is a seat where both halves count — revenue operations, performance and data analysis, or a commercial role with real ownership of the systems behind it. I have never needed a category to be handed to me before I could be useful in it, and the shelf below is the evidence: most of it is a domain I had to learn quickly, instrument, and then act in.
Full profile & résuméthe whole record, a capability ledger, and a version that prints

What I'm looking for

Specific enough to disqualify a bad fit

Being vague here wastes both of our time. If three of these four columns are wrong for your role, it is probably not the role.

Titles

  • Revenue Operations — Manager or Director
  • Performance, business, or revenue analyst · analytics lead
  • Solutions consulting · sales engineering · GTM engineering
  • Also a fit: business development, partnerships, or sales leadership

Companies

  • B2B SaaS, commerce, retail, and logistics software
  • Anywhere the revenue data exists but nobody owns the joins
  • AI tooling where the buyer asks technical questions
  • Where marketplace domain knowledge pays off on day one

Arrangement

  • Remote, or hybrid in the Greenville, SC metro
  • Open to travel for accounts and events
  • Currently remote and productive that way

What I need

  • Access to the data, and a real decision hanging on it
  • Permission to build the answer, not just file the request
  • A number attached to the work — I do better work with one
Open to new roles

Show me the data and the decision hanging on it.

Revenue operations, performance and data analysis, or a commercial role with real ownership of the systems behind it — particularly at companies building for commerce, retail, or logistics, where the domain knowledge is worth something on day one.

Or paste a job description into the Role Lens above and it will reorder the whole shelf against that role before we ever speak.